Sandboxes
Sandboxes are pages independent of any network. They are areas where you can experiment with creating content.
Markdown previewing
The markdown sandbox is a simple previewer when you can input markdown-formatted text and observe the html-formatted output. The functionality is similar to many other markdown previewers on the web.
Generic makealive components
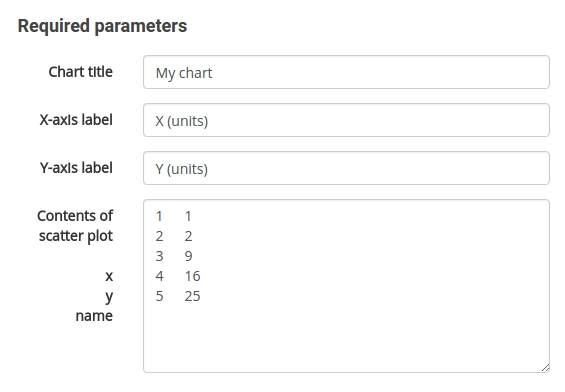
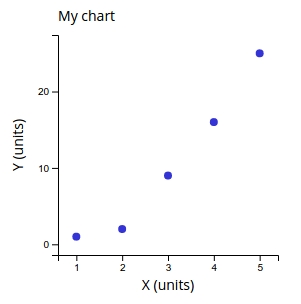
Other sandboxes help to create generic data visualizations such as bar charts, scatter charts, or venn diagram. Each sandbox has a form where you can enter data and tune some

The form generates two types of output at the bottom. On the left is a text area with text code in makealive format. On the right is a rendering of the data.

You can copy paste the makealive code and reproduce the chart on any content page or comment box.
Network-specific makealive components
Some sandboxes are set up to query the NetworkCurator database API. For example,
the nodeneighbor component produces venn diagrams in which one set consists
of all nodes that are linked with a query node.
Network definitions
The final sandbox does not produce visual output. Rather, it helps produce network definition files that can be uploaded onto the site via the data import feature.
Type in definitions for network components into the text areas. Or cut-and-paste such definitions from a spreadsheet. The sandbox will place the information into the correct JSON format.
Table of Contents
Users Guide
- Overview
- Installation
- Administration
- Web interface
- User accounts
- Permissions
- Ontologies
- Graphs
- Annotations
- Comments
- Sandboxes
- Data import
- Data export
- Analyses
- Other software
